7 Ways to Use Data in Your Nonprofit’s Storytelling
Data visualizations can bring your nonprofit’s story to life. Here’s how.

When used well, data can take your nonprofit storytelling to the next level.
Data provides better understanding of your organization and mission, donation asks and donation goals. It even helps others see greater value in your work.
The Venngage “Data Storytelling Benchmark Report 2021” provides a case for using data in nonprofit storytelling.
“Data storytelling couples data visualization with compelling narratives that help audiences better comprehend and take action based on data analysis. While effective data visualization helps people grasp and remember key takeaways, data storytelling is essential for helping them understand why those takeaways matter,”
– according to Lydia Hooper, data visualization expert and information design writer.
But how do you use it? Here, we’ll provide tips – rooted in data, of course – to help you master this essential skill and help enhance your nonprofit’s storytelling.
1. Show Results and Trends
Your nonprofit story can be one of the most compelling elements when it comes to creating an active donor.
The Venngage report shows that the top marketing objectives for any campaign are to:
- Build loyalty
- Convert leads
- Attract new leads
- Build brand awareness
- Build brand authority
These are the exact things your nonprofit is likely trying to do as well, making data your secret weapon.
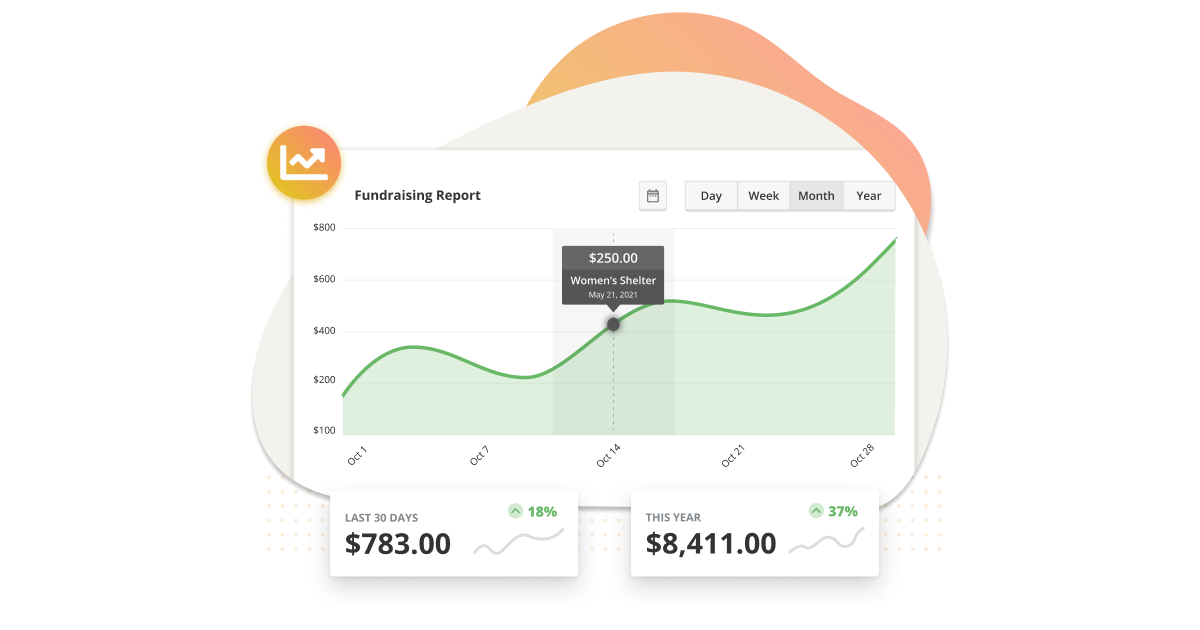
Use data to show results and trends as they pertain to your organization.
- How much money have you historically raised?
- What projects or outcomes came as a result?
- How does that look over time (show trends)?
- Where does each donated dollar go (show funding allocation)?
Sometimes these explanations, especially when presented in a visual manner, can make the mission and goals of your organization seem that much clearer.
Data can help show successes and wins as well as reason for higher asks or a greater need.
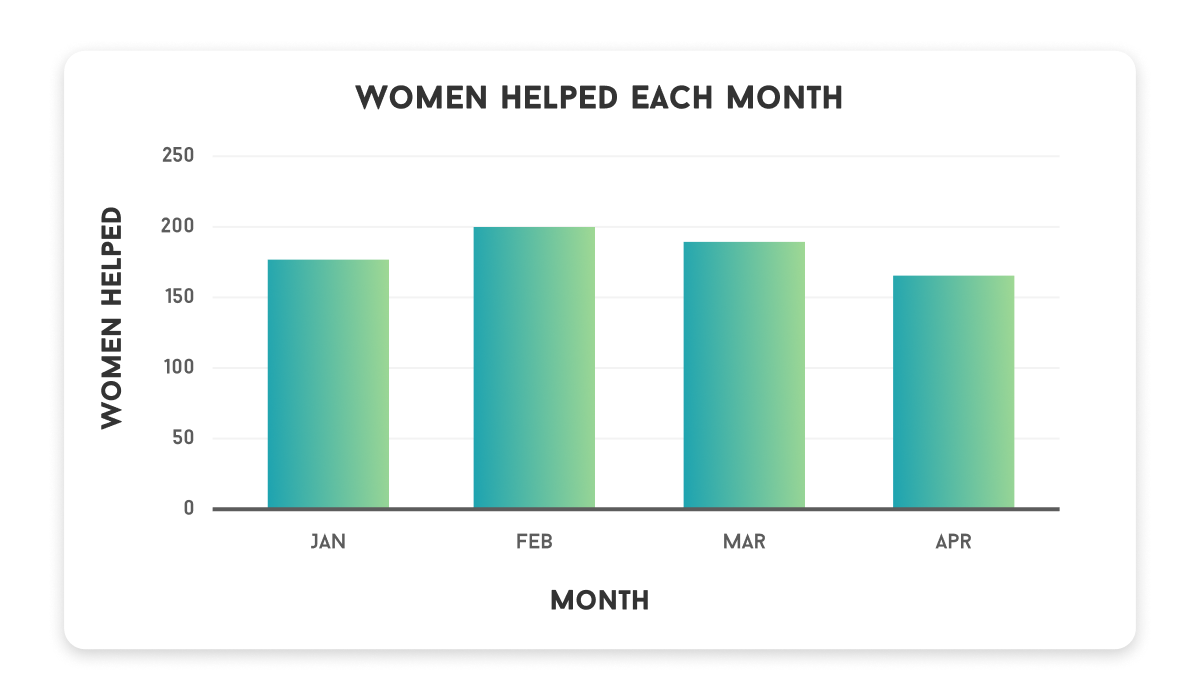
In addition to organization specific data, you can also show need trends that support your nonprofits mission. Create a chart or narrative that explains who or what you help and how that need has changed over time. A trendline can not only help you establish donor relationships, but also frame fundraising goals and strengthen your overall organizational story.
2. Explain Tables or Complex Information
Not only can data be used to support your story, focusing tables or complex information into a narrative can make it easier to understand. This is often where a data visualization comes into play.
Let’s be honest. How often have you popped a giant table from a spreadsheet into an email or communication with donors? While there’s no doubt that it contained useful information, the delivery fell short or may have been ignored altogether.
Use data for nonprofit marketing in a way that makes sense to someone without deep knowledge of your organization.
Turn spreadsheets and or tables into charts that show something at a glance. (If you have to ask why the chart is there, you probably don’t need it.)
Support charts or other data visualizations with appropriate narrative.
Show the data and tell the story.
It takes both elements to be most successful.
3. Maps Enhance Nonprofit Storytelling
One of the easiest ways to add data to your story is mapping.
Maps are also one of the most overlooked data visualization tools.
Maps are an amazing tool that can show everything from a physical location to where donors come from to locations your organization serves.
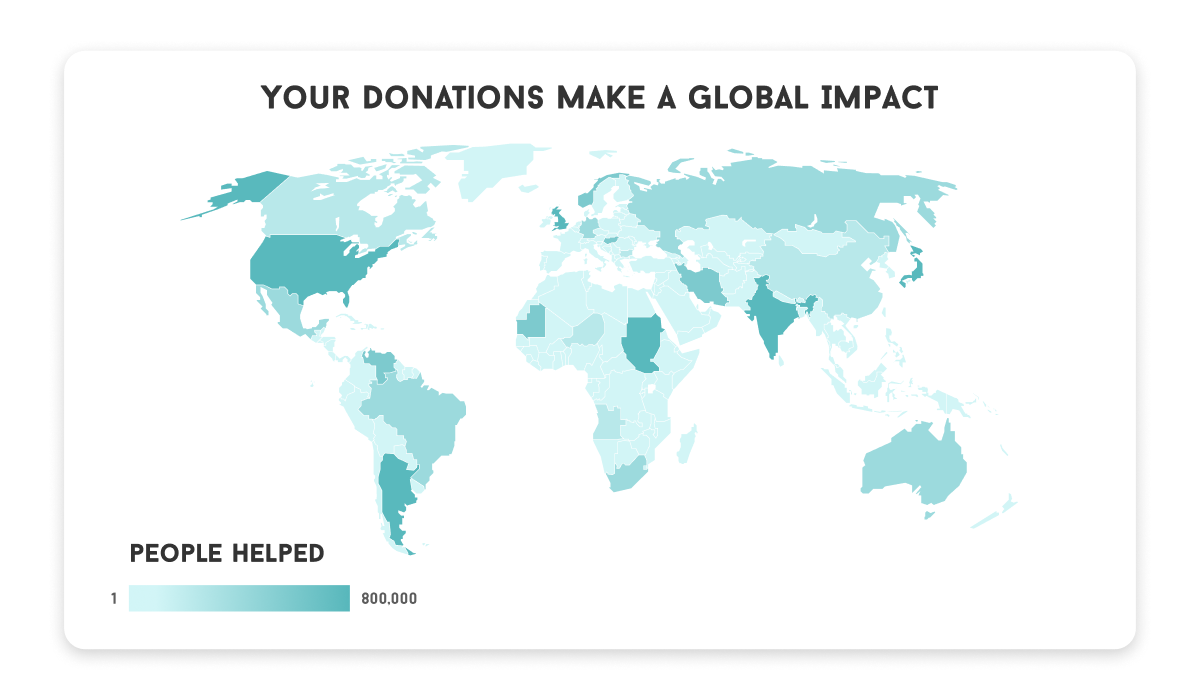
Most nonprofit stories can benefit from some type of map.
4. Establish Relationships
One of the most important roles of storytelling for any nonprofit is to establish and cultivate relationships.
Much of this style of storytelling doesn’t change a lot over time with an established organization, making evergreen content your friend.
Evergreen content is anything on your website that is always applicable. This is your core organization story and elements that support the mission.
You can keep evergreen pieces fresh with current (don’t forget to make the updates) or long-standing data points.
Current data points may include information such as:
- Campaigns or goals
- Recent outreach efforts
- Data from an annual report or donor impact report
Long-standing data points likely show information that’s less subject to change like:
- Maps
- Big number goals (such as more than $5 million raised in the past 5 years)
- Number of partner organizations or donors

Like What You’re Reading? Subscribe Here!
Newsletter Opt-in
5. Break Down Numbers for Social
The top reason that organizations use data storytelling is for social media, according to the Venngage report. A whopping 74% of marketing pros use data on social media, followed by presentations (41%), videos (34%), reports (33%), blog posts (28%), newsletters (26%), and ebooks (12%).
Numbers, charts, and other data points can make great story starters for social media. Just think of how rooted everything in social is from numbers of followers to seeing likes or comments to the little progress bar at the top of Stories.
Using numbers – keep it to one number per panel or frame – can be an effective way to highlight a nonprofit mission or cause on social media. The Stories format on Facebook and Instagram is almost made for showing small segments of data, one number at a time.
GiveWP has a guide to nonprofit storytelling on Instagram that can help you frame your numbers into a viable social media story.
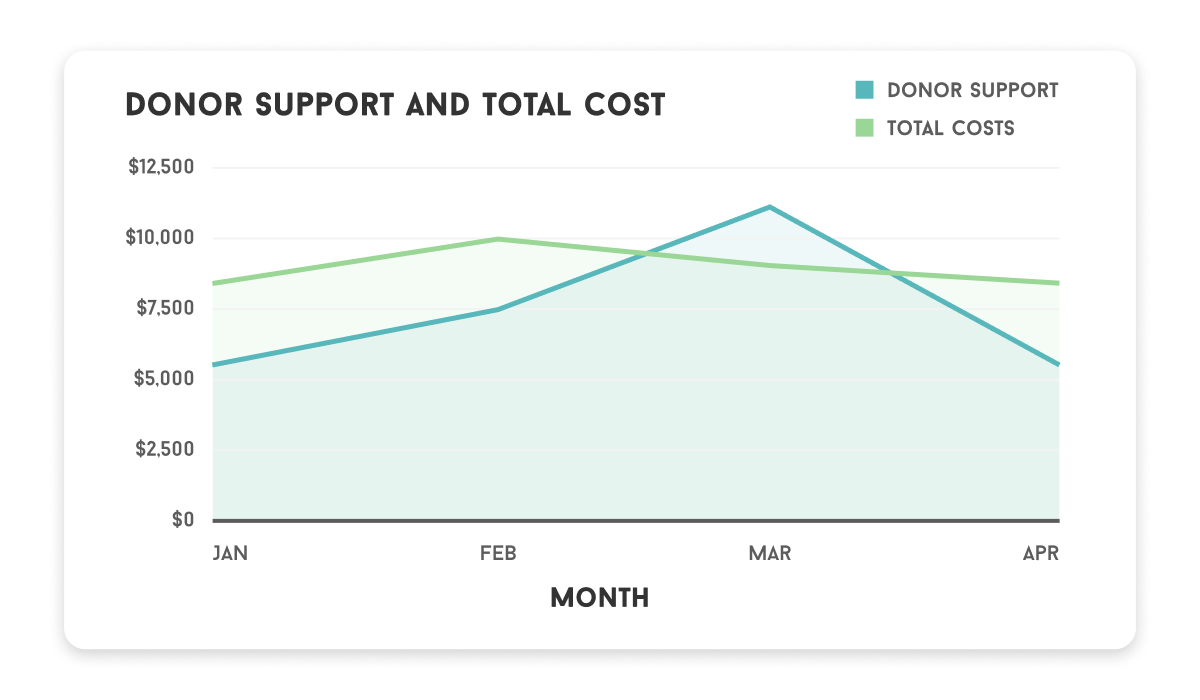
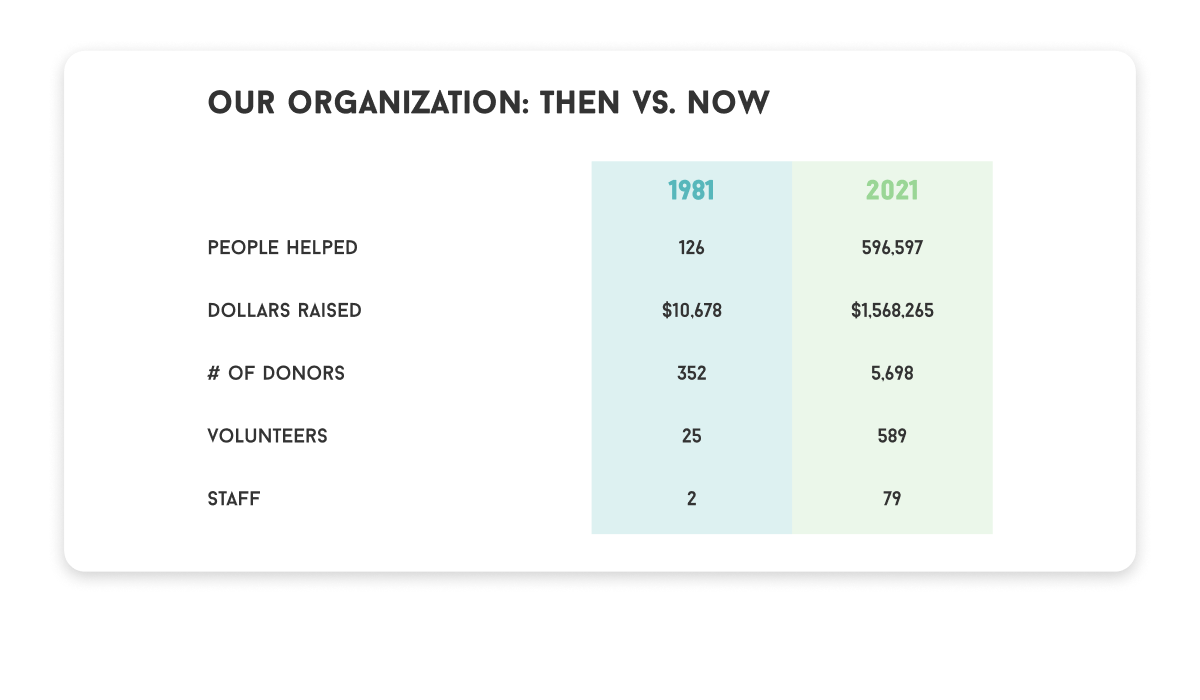
6. Create Comparisons
Data can tell a story of growth over time, show comparisons to other campaigns within your organization, or help show how your nonprofit is different from another seemingly similar group.
To create the most effective data story, use numbers with purpose. Pick out the biggest, boldest, most impressive numbers as a framing point for storytelling.
Not sure what numbers will have the most impact on potential donors? Start with top-level metrics.
- Total donations (year to date, for a certain campaign, or all time)
- How many people/animals/groups you have helped or served
- Number of volunteers or partners
- Time spent working in the community toward your mission
- Number of corporate donors (or dollars)
- Rankings or accolades
7. Show Goals
Here’s a data storytelling trick that almost any nonprofit can deploy right now.
Add a goal thermometer – or any kind of progress bar – to your marketing campaign materials.

This simple design element uses data to tell the story of how your efforts are going.
Highlight key data points:
- Overall goal
- Timeline
- Progress goals for specific dates or funding levels
- Current donation levels
Think of how this data could encourage someone to increase their gift to push the campaign over the overall or a progress goal point. Imagine someone sharing with their networks online with the ability to show the progress of impact they can have on the community or your organization?
The key takeaway from this data storytelling tip and the others above is that data doesn’t have to be overly complicated to be useful. The best data storytelling uses information to enhance the overall narrative you are trying to share.
Data is a Nonprofit Marketing Secret Weapon
Data can help your stories have more impact, credibility, and even encourage future gifts. Further, data can help validate the work you are doing with results that are tangible and understandable.
The toughest part about incorporating data into your storytelling can be figuring out how to use it in a way that makes the most sense. Use charts and visualizations when you can to ensure that information is digestible and easy to understand.
GiveWP has built-in data visualization tools that can help you get started. If you’re using GiveWP, go to your fundraising reports. If not, download it for free now.
Amplify your fundraising with a GiveWP Plan
About the Author
Carrie Cousins
Carrie Cousins has more than 15 years of experience in media, design, and content marketing. She’s a writer and designer, has an MBA from Virginia Tech, and is passionate about creating amazing experiences for businesses online. Her work has been featured in publications such as Design Shack, Webdesigner Depot, The Next Web, and Fast Company. She’s an avid runner, which comes in handy with a trio of Australian shepherds at home.