There’s a free tool that can help you understand your donors much better and help you create better content just for them. You’ve probably already heard of it: Google Analytics.
Before your nonprofit had a website, understanding the motivations and passions of your donors took a great amount of effort and research. Now, with Google Analytics, you have readily available tools that can help you build compelling content and impassion more people to donate.
One of the greatest free tools that you can use is Google Analytics. Many site owners install the system onto their site, few review their data after the installation, and even fewer use the tool to their advantage. But those that do dig into their analytics data can reap many benefits and make many discoveries about how their site visitors interact with their site and convert into donors.
Before we dig into the data, we have some other steps to take.
Before we have answers, we need questions.
Your analytics data is a massive treasure trove of information that you could spend decades digging through. With so much information about your visitors (their location, browser, demographics, etc.) and how they interact with your site (the site that referred them, which pages they went to, how long they spent on the site, etc.), a lot of people are overwhelmed when they first open up their analytics and give up.
There’s a fundamental issue with the approach that most business owners take with this – they are looking through the data to find answers without going in with any questions! That’s like trying to solve a word search puzzle without the word bank. It’s possible to accomplish things this way, but you’re starting out with a disadvantage.
So what questions can we be asking before we open up the treasure trove?
Indirect questions: just the beginning
Indirect questions are those that lead to more investigations and don’t give actionable answers.
For example, an indirect question can be, “What percent of our donors are on the site for less than 2 minutes?” If we find that 90%+ of donors are completing their donations very quickly then leaving (ie high bounce rate), that may tell us that our offline marketing is doing well or that most of our donors are repeat donors that are familiar with the organization and its mission. This might also tell us that we need to improve our “Thank You” page to encourage donors to dig into our content more deeply.
However, this high percentage could also mean that the longer people spend on the site (metric: time on site) and read the content, the less likely they are to donate because the mission isn’t being conveyed well. Or maybe the homepage is the only page with a donate page so visitors who go past the homepage aren’t seeing any information about donations.
As such, indirect questions never give us the full picture. Just because you get an ‘answer’ doesn’t mean you should start making changes to your suit to alter the results.
Direct questions: high visibility, low impact
Direct questions give us answers that we can usually take action on immediately.
An example of a direct question can be “Which pages have the highest bounce rate?”
Some vocab: a visitor ‘bounces’ when they leave the website, and the ‘bounce rate’ for a page is what percent of visitors leave the site when they’re on that page. If half of your visitors hit your homepage then leave right away, the bounce rate for your homepage would be 50%.
With our question in hand, we can now dig into Google Analytics and finding our answers. Perhaps our Volunteer page has the highest bounce rate. Now we can start taking action – are there no more volunteer opportunities so visitors are leaving disappointed? What if we add an email notification form that tells them when new opportunities will be available? What if we send them over to our social media pages to stay in touch? There’s a lot we can do to keep the visitors around and keep them a part of our community.
Viewing demographic information
By default, Google Analytics only tracks a limited amount of information from your visitors. Without turning on the feature, your site does not track demographic information, which means you won’t be able to know the age, gender, and interests of the people accessing your site.
To enable this feature, head into your Analytics dashboard then navigate to Audience > Demographics > Overview within the sidebar. You’ll see a screen that invites you to enable the feature, but does give you a heads up that you may need to update your privacy policy when you start gathering the additional data.
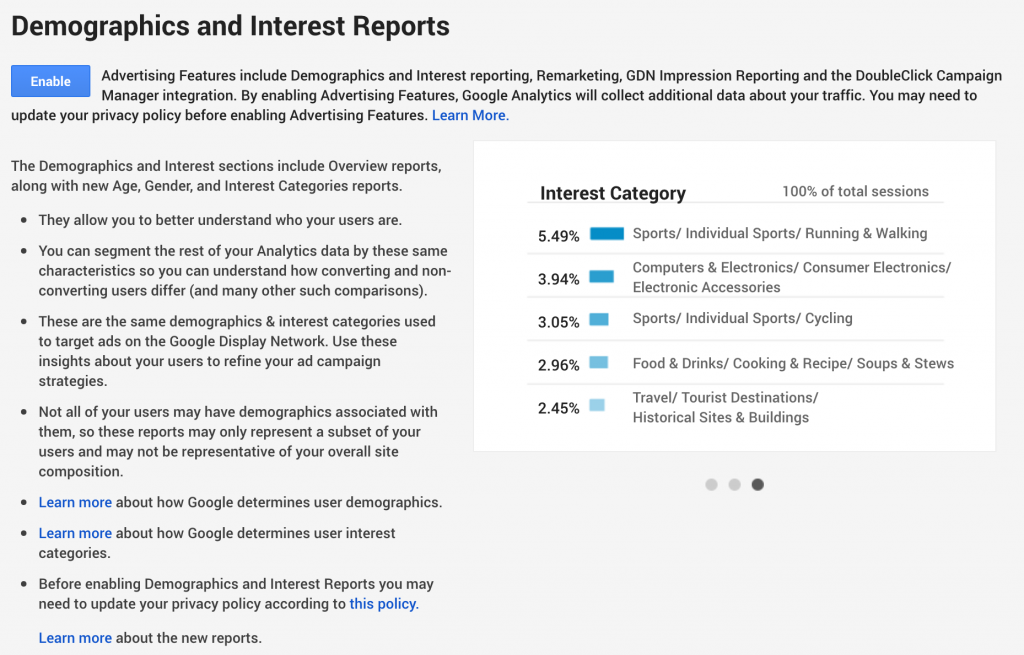
Since your site isn’t gathering the demographic information until you enable it, you won’t be able to view any historical data. This is a feature we recommend enabling right when you find out about it – that means right now!
Buyer beware: analytics can be misleading.
Here’s the crazy things about analytics: even the ‘answers’ of the direct questions can be misleading. Since Google isn’t in the head of every visitor, the data can be misleading. What if a bunch of donors just get distracted by their barking dog on the payment page and forget to complete it? What if there’s just a slow week because of a holiday?
Your organization’s goals can affect what action you should be taking as well. Would you rather have 1,000 new donors this quarter or would you rather have 1,000 previous donors come back and donate again?
Lastly, analytics data is only valuable if you have a good amount of visitors accessing your site. Trying to extrapolate information from the two visitors that accessed your site won’t tell you anything — averages are your friend.
One bonus tip: make sure your analytics tracking excludes yourself. I once had a new client that thought he was getting 300 hits a day to his site; it was actually just his browser. It would open the site whenever he created a new tab. Nobody was actually viewing his site.
Next up: digging into the tools
In my next guest blog post here, I will share step-by-step guides for gathering data from your Google Analytics account and some actions you could take to improve your site.