Preview the Fundraising Performance Indicators Coming in GiveWP 2.6
GiveWP 2.6 reports provide all users with the donation reporting dashboard they need to easily monitory key fundraising performance indicators.
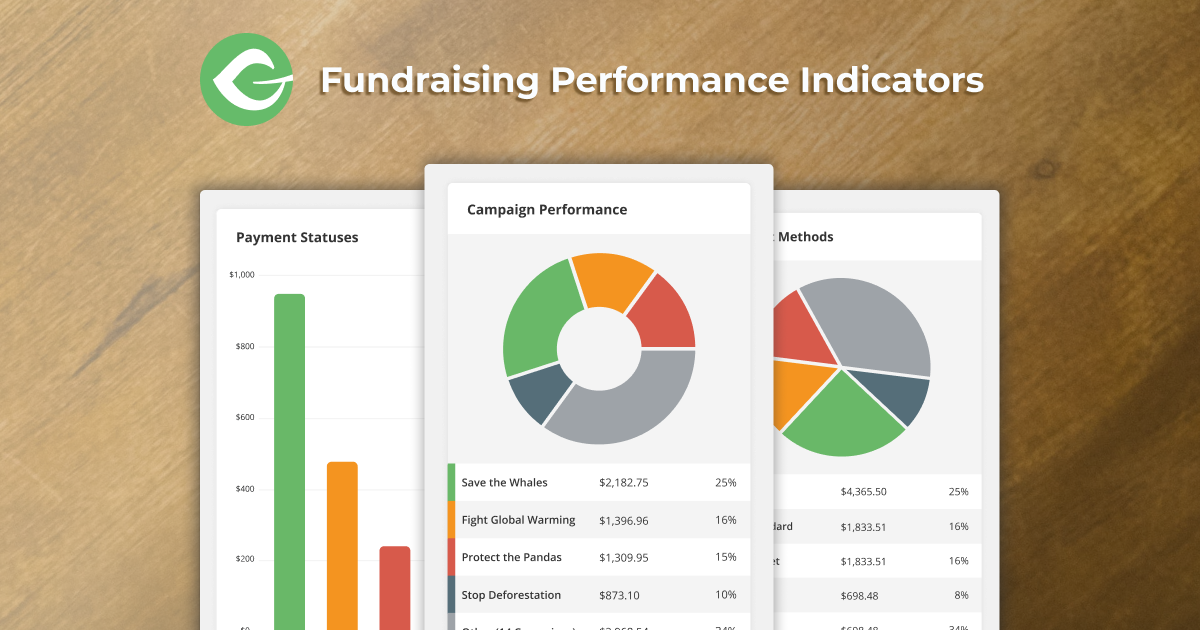
Imagine you can see all of your key fundraising performance indicators on one screen. That’s what we had in mind when we redesigned the new GiveWP Reports.
To create your new reporting dashboard you need, we looked around for best practices before diving into design. Our research helped us narrow down the most important fundraising performance indicators taken from your GiveWP forms.
What’s Included in The New GiveWP Reports?
In GiveWP 2.6, your reports will include a lot more data. You’ll get an understanding of your online fundraising campaigns like you’ve never been able to before.
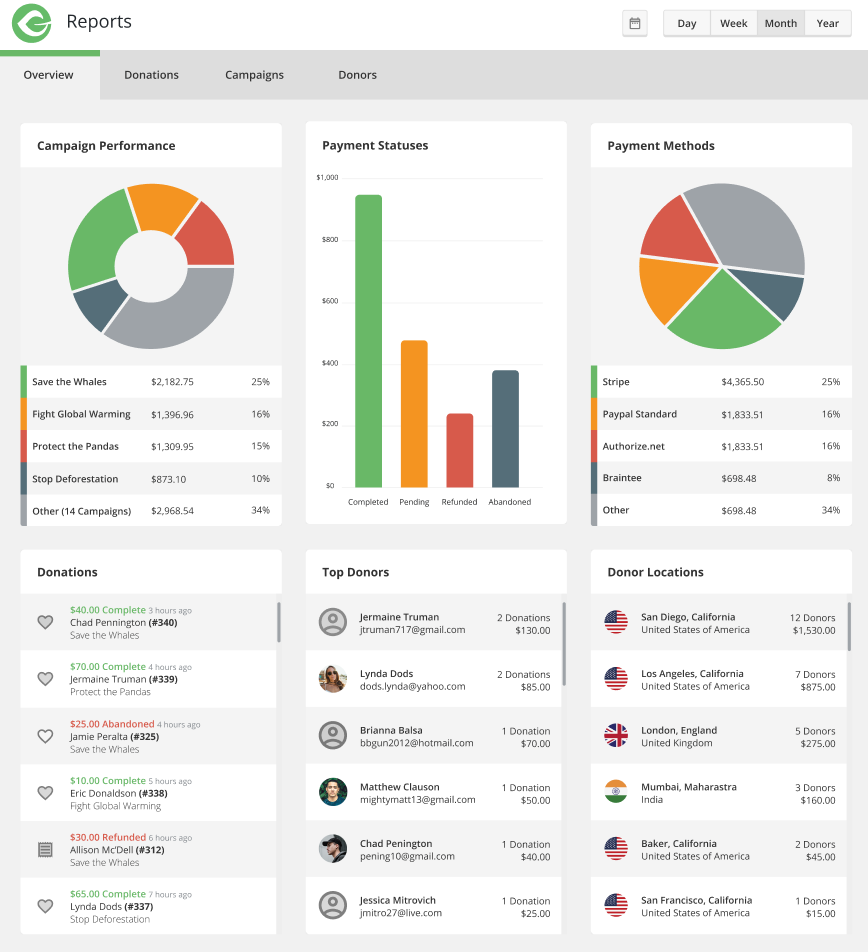
New data points introduced in GiveWP 2.6:
- Income Over Time
Line chart depicting site-wide income for the selected period of time. Each datapoint shows the amount earned and the number of donations for that point in time. - Total Income
MiniChart depicting total income earned for the selected period of time, as well as the current trend in income. - Total Donors
MiniChart depicting total individual donors for the selected period of time, as well as the current trend in donor count. - Average Donation
MiniChart depicting average donation amount for the selected period of time, as well as the current trend in average donation amount. - Total Refunds
MiniChart depicting total number of refunds for the selected period of time, as well as the current trend in refund count. - Top Form Performance
Pie chart depicting popularity of the top donation forms for a given period of time. - Payment Statuses
Bar chart depicting current payment status counts (completed, abandoned, refunded, cancelled) for a given period of time. - Payment Methods
Doughnut chart depicting popularity of different payment methods for a given period of time. - Top Donors
List of top twenty-five donors for the selected period of time. - Recent Donations
List of twenty-five most recent donations for the selected period of time. - Bonus: Top Donation Locations
List of top ten donation locations for the selected period of time (queried using city/country meta data).
Good News! GiveWP 2.6 is Here!
We released GiveWP 2.6 with every data point we promised. Check out the announcement! Or go straight to your WordPress site and update GiveWP to see your reporting dashboard now.
About the Author
Taylor Waldon
Taylor is the Director of Marketing for GiveWP, a WordCamp Speaker, and full-time RVer. She has a Master’s Degree in International Relations (concentrating in Global Conflict Development, Resolution, and Management). She’s an advocate for people with disabilities, a meme queen, and a dog-mom.