Reports
Reports provide you with an easy-to-digest overview of the current state of your donation forms. They give you a birds-eye view of how your forms are performing overall.
Articles in this section:
 Legacy Reports
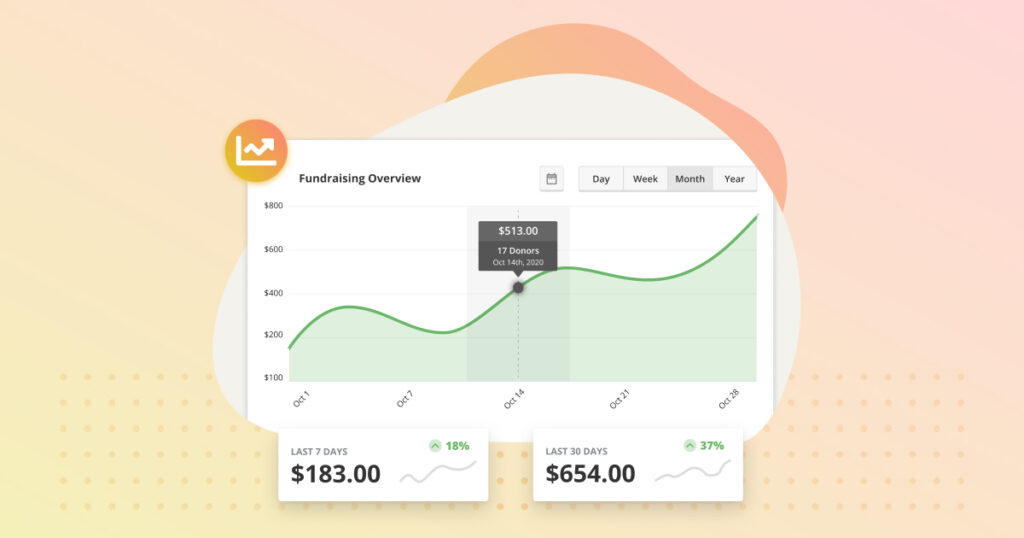
If you want to download a spreadsheet/CSV with details of your donors or donations, see the Export Settings.
Reports are organized into a few main tabs:
Overview Tab
This is the default tab when you click on “Reports.” It shows a graph with income earned over the last week. You can change the timeframe by day, week, month, year, or custom. It also shows you helpful data for your selected timeframe, including total income, total number of donors, your average donation, and more.
Click here to learn more about the Reports Overview tab.
Legacy Reports Tab
This tab opens up 3 new tabs that were included in GiveWP prior to the 2.6 release. This view allows you to get a little bit more granular, as opposed to the summaries on the Overview Tab.
Income Tab
This is the default tab when you click on “Reports.” It shows a graph with income earned over the last week. You can change the timeframe by day, week, month, year, or custom. It also shows you helpful data for your selected timeframe, including total income, total number of donors, your average donation, and more.
Click here to learn more about the income tab.
Form Tab
This tab provides you with a list of all your Forms and their overall performance according to number of Donations, total income, Monthly Average Donations, Monthly Average Income, and a link to view a more detailed report of that form.
Click here to learn more about the form tab.
Donation Methods Tab
This table lists your activated payment gateways to show how many donations each has received according to completed transactions, failed transactions, total transactions and total donated.