How to Open the Developer’s Console in Your Web Browser
Issues on a website can be terrifying, but most of the time the browser informs what is wrong. When there are issues on your website, it’s crucial to verify if the browser is reporting those errors. Your website displays errors related to the front end on a browser section called Developer Console — a console the developers can use to see if everything is running correctly or not.
How to enable the browser’s developer console for troubleshooting
Each browser has its settings for the developer console, and it’s essential to know how to use them. Below is coverage for the most used browsers and how to open up the developer console.
Google Chrome
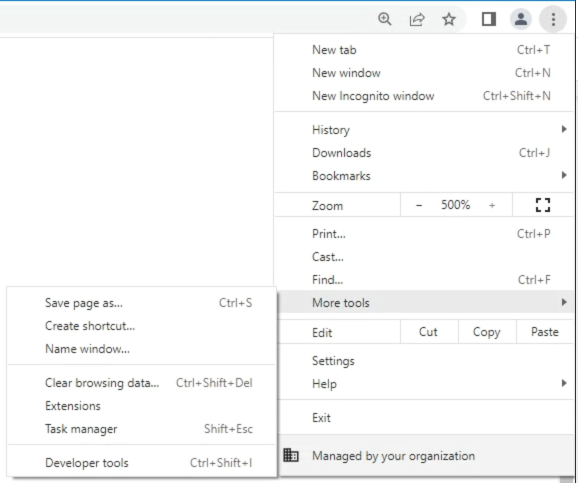
To open the developer console in Google Chrome, navigate to the Chrome Menu in the upper-right-hand corner of the browser window and select More Tools > Developer Tools.
If you are a shortcut person, you can also use Shift + CTRL + J (on Windows/Linux) or Option + ⌘ + J (on macOS) to open up the developer console.
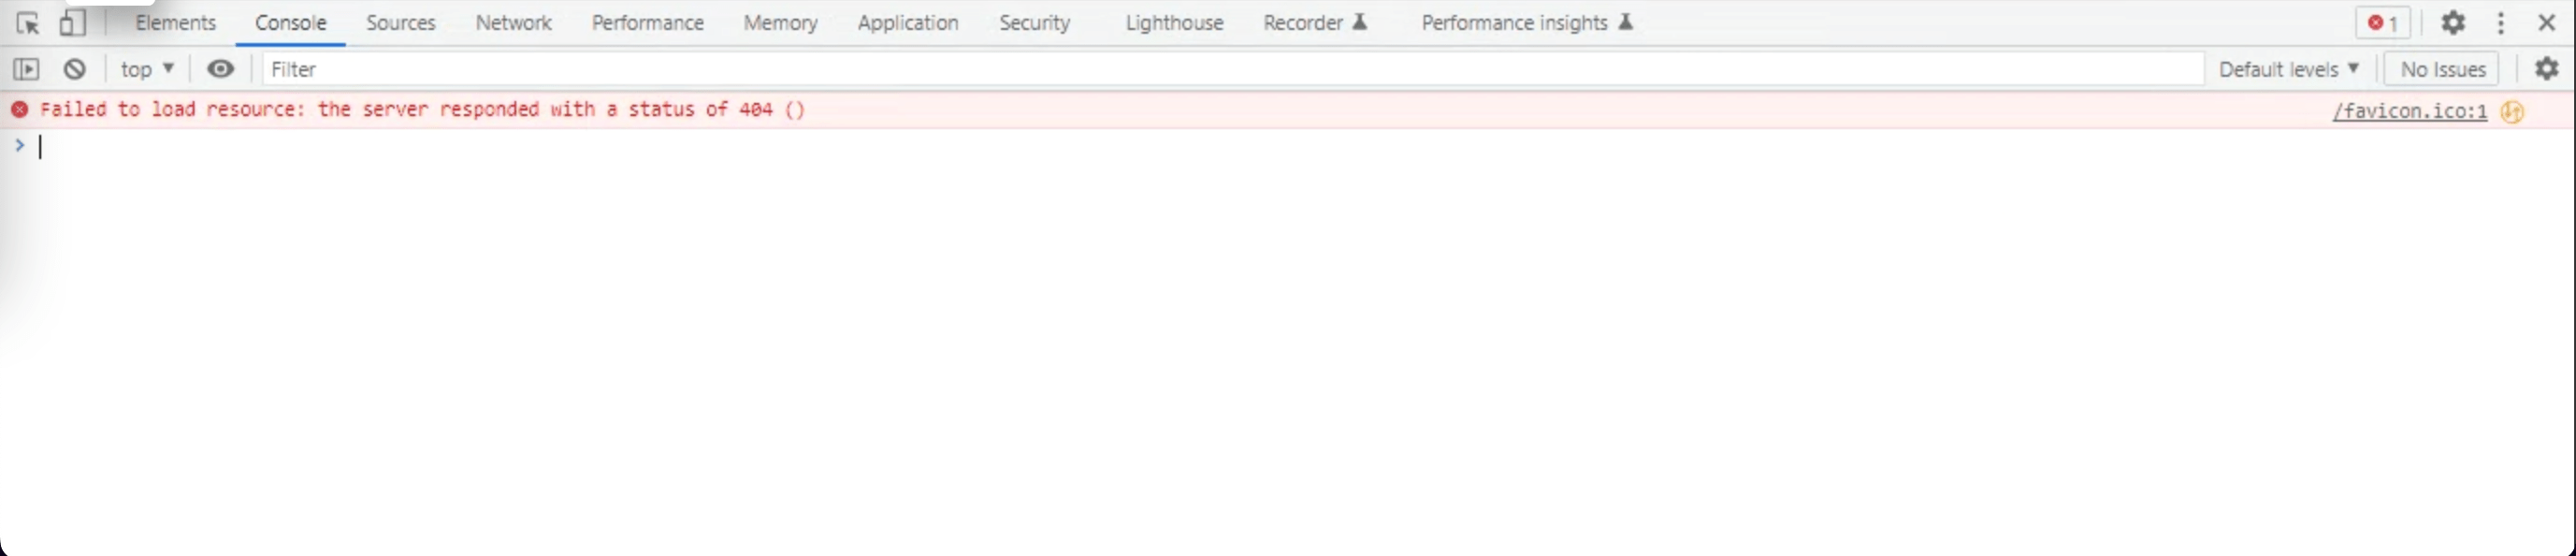
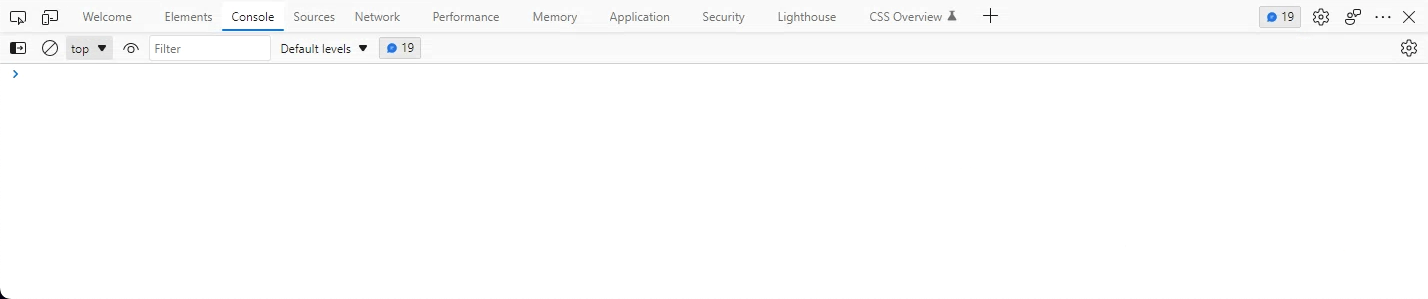
When the Developer Tools section shows up, click on the Console tab, and errors, warnings and messages will appear on it.
Apple Safari
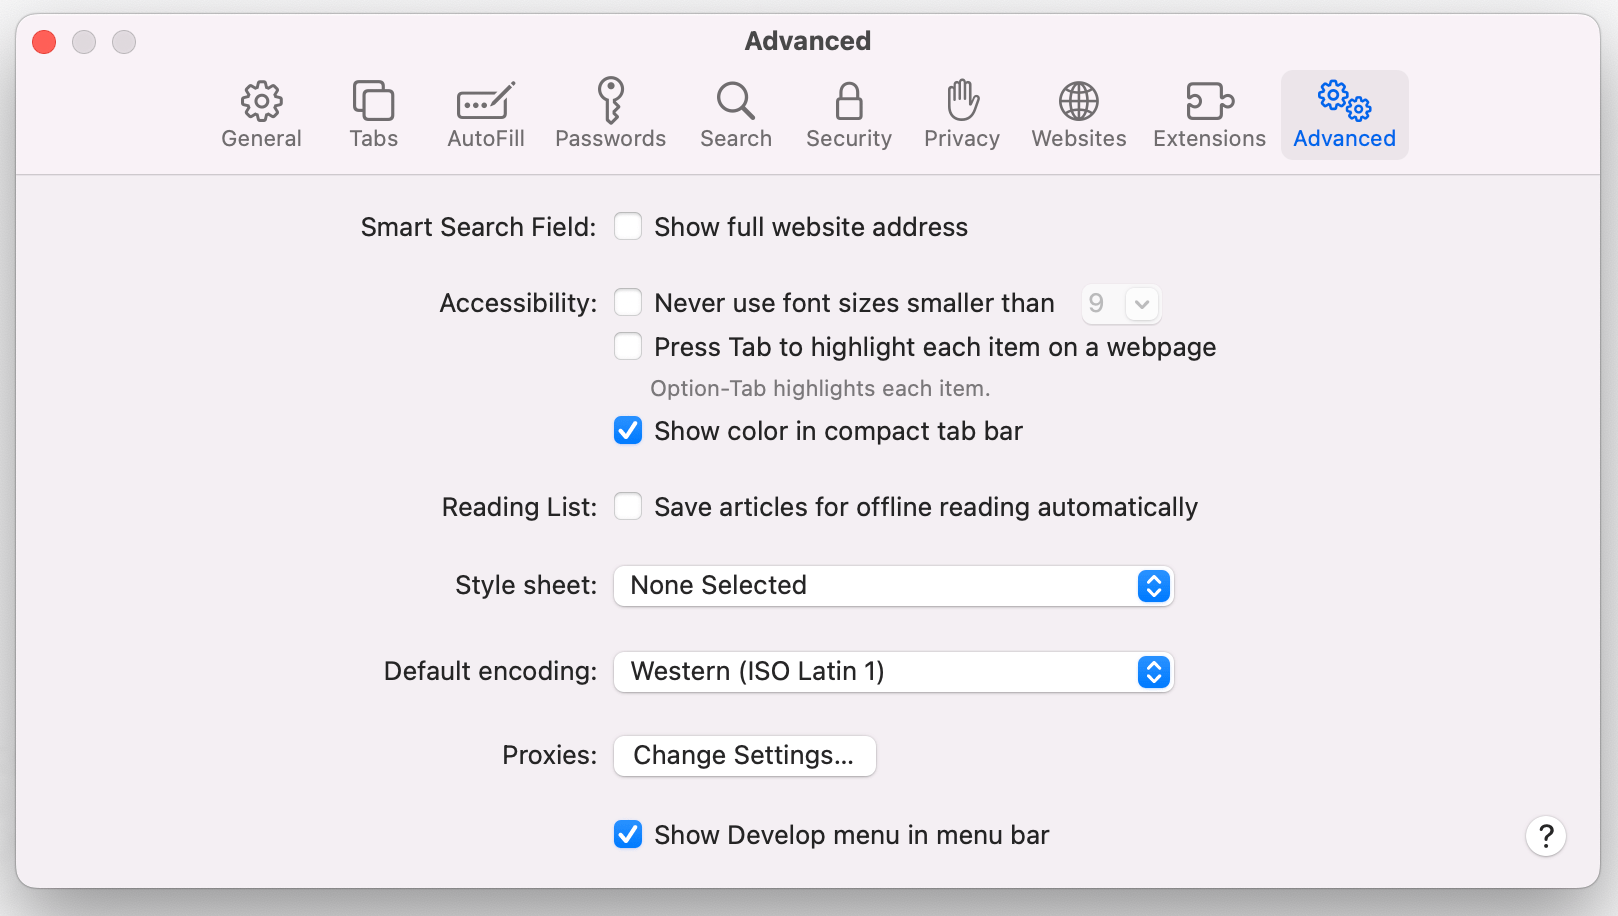
The developer console on Safari shows up only if the developer menu is enabled. To do that, navigate to Safari’s settingspreferences menu (Safari Menu > SettingsPreferences), click on the Advanced tab, and, at the bottom of the window, there will be an option to enable the Develop menu. Make sure you check it.
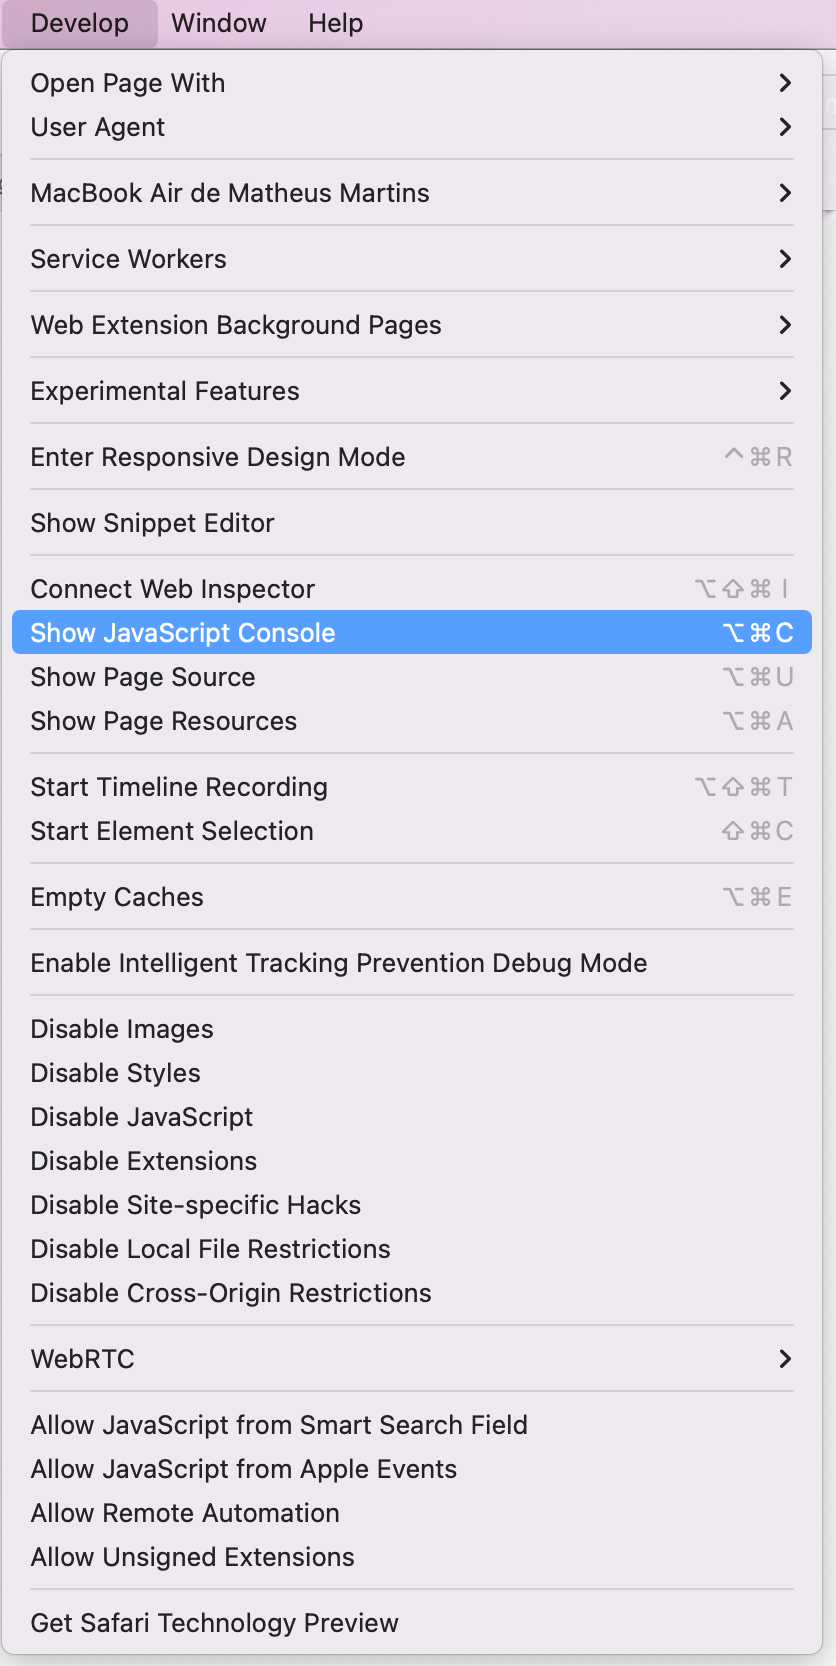
Now the tools to use the developer console are ready. To use them, on the browser menu options, click on Develop > Show JavaScript Console (you can also use the shortcut Option + ⌘ + C).
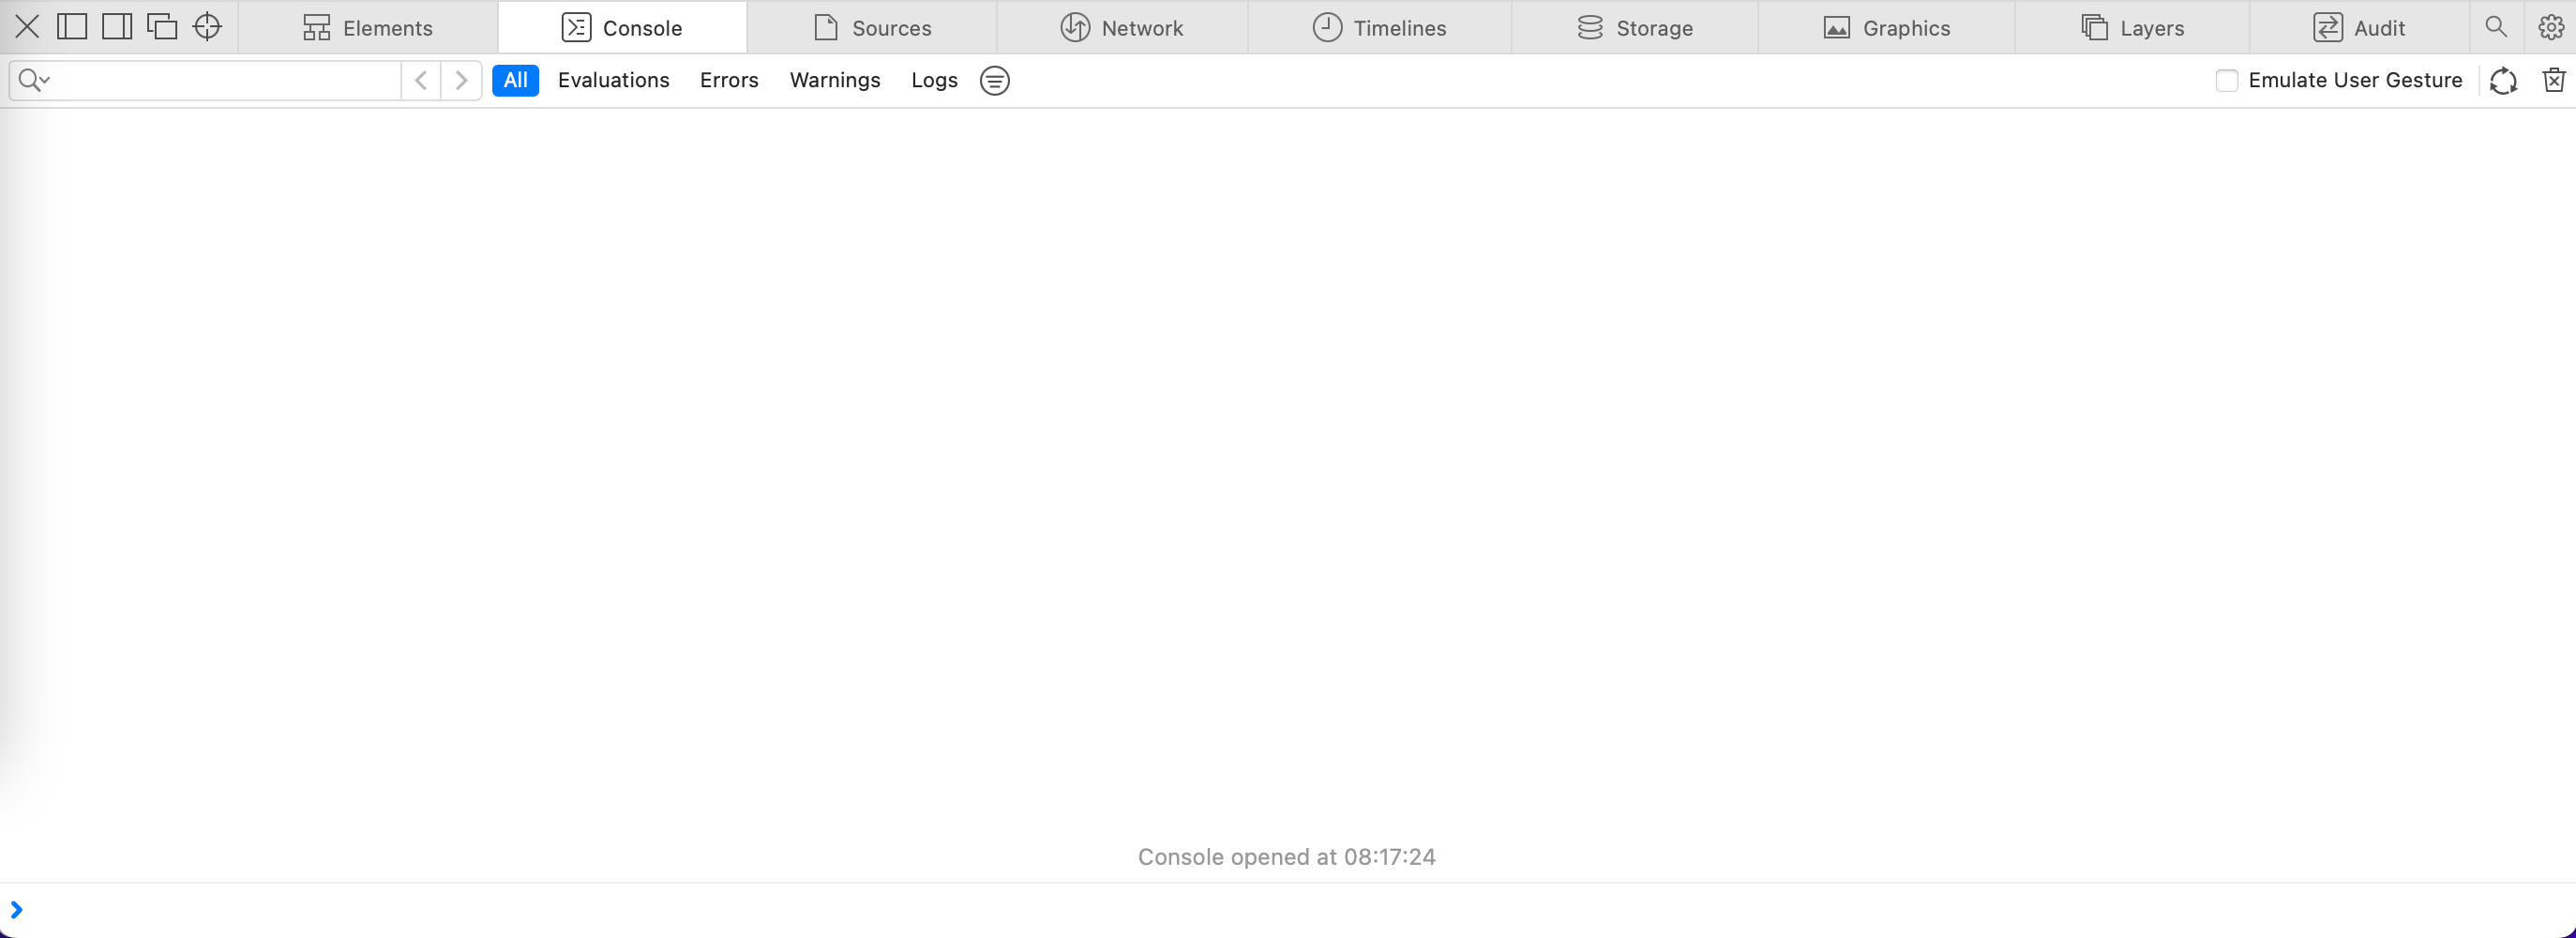
The console will either open up within your existing Safari window or in a new window. It will automatically select the Console tab.
Microsoft Edge
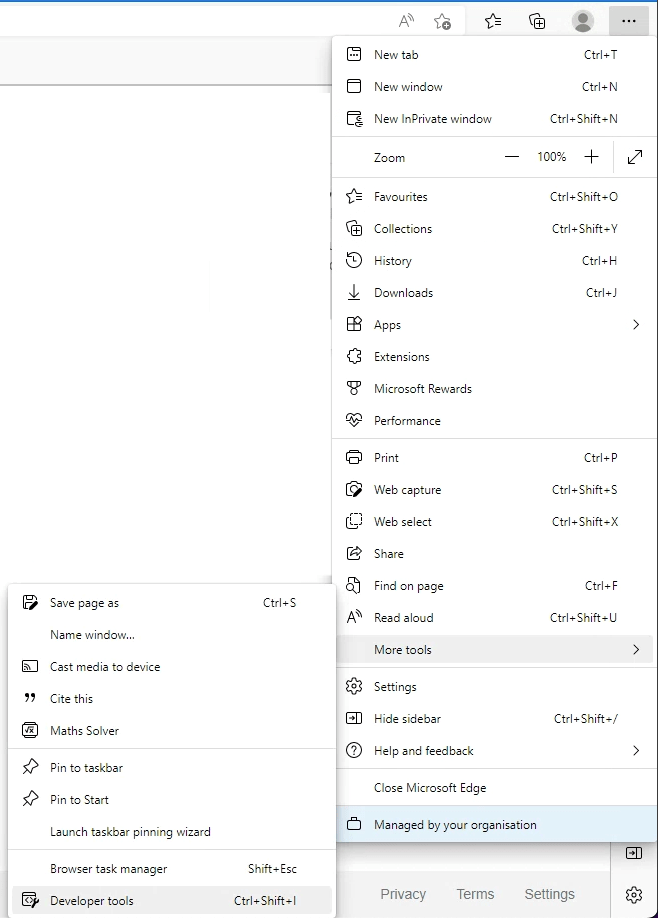
To open the developer console using Microsoft Edge, navigate to the upper-right-hand corner of the browser and click on More Tools > Developer Tools.
You can also press CTRL + Shift + i to open it.
When the Developer Tools section emerges, click on the Console tab and errors, warnings and messages will appear on it.
Mozilla Firefox
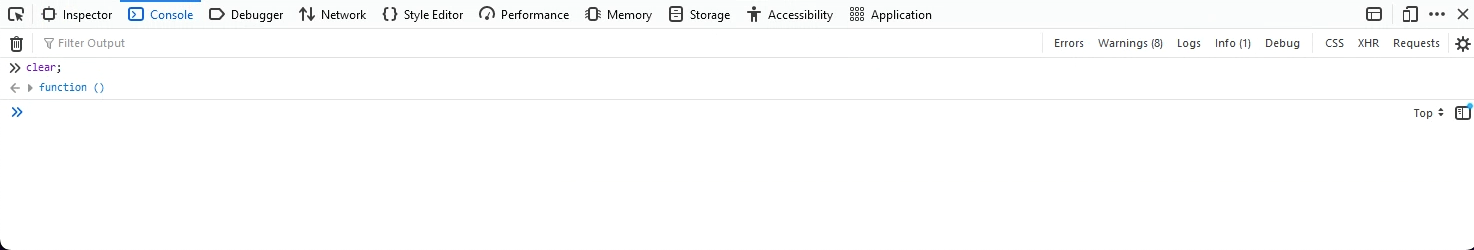
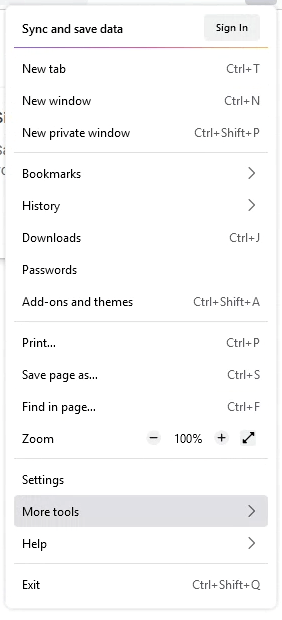
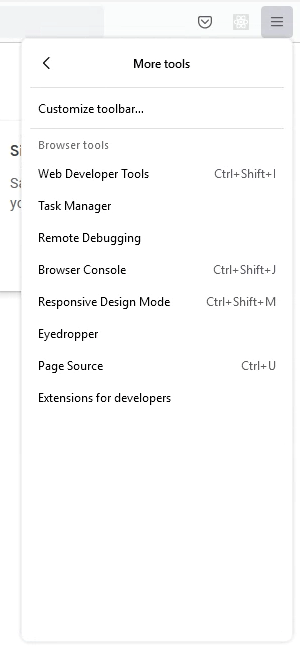
To open the developer console in Mozilla Firefox, navigate to the Firefox Menu in the upper-right-hand corner and click on the More Tools menu item. Then, a new menu will show up and you should click on Web Developer Tools.
You can also use the shortcut Shift + CTRL + J (on Windows/Linux) or Shift + ⌘ + J (on macOS) to open up the developer console.
When the Web Developer Tools section opens, click on the Console tab and errors, warnings and messages will appear on it.